
 EN

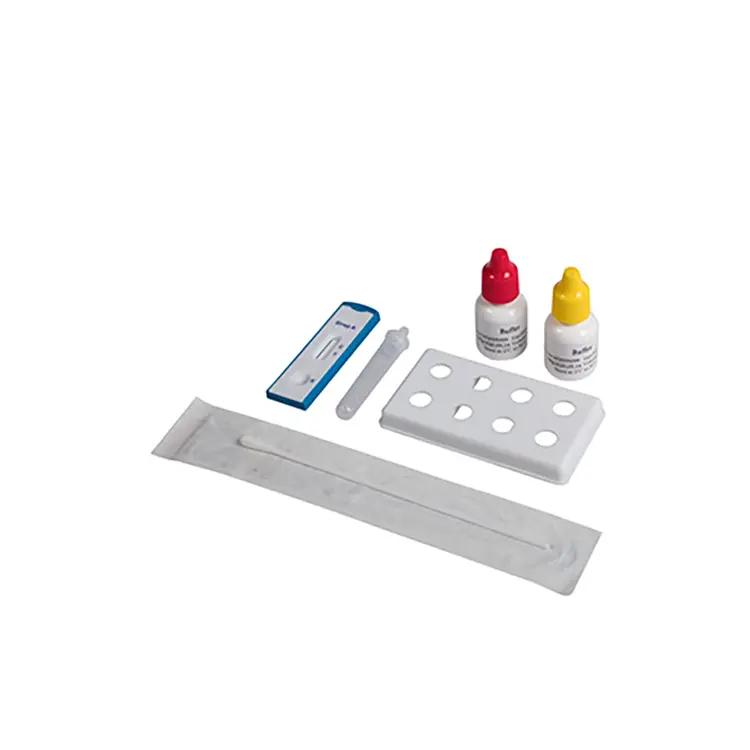
Evaluating the performance of a rapid diagnostic test requires rigorous scientific methodology and careful validation protocols. When healthcare organizations or regulatory bodies assess whether a rapid diagnostic test meets clinical standards, they must measure two critical performance indicators: sensitivity and specificity. These metrics determine how reliably a rapid diagnostic test identifies true positives and true negatives in real-world conditions. Blinded panel testing has emerged as the gold standard approach for obtaining unbiased, reproducible results that demonstrate the true capabilities of a rapid diagnostic test without external influence or observer bias.
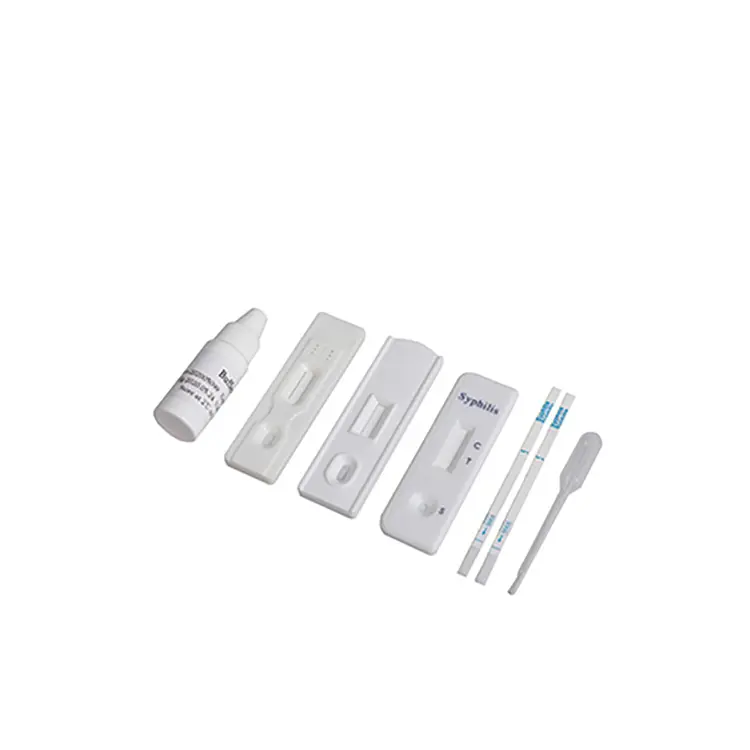
Blinded panel testing removes subjective interpretation and ensures that a rapid diagnostic test evaluation reflects genuine device performance rather than operator expectations or bias. This approach has become essential in diagnostics, particularly for infectious disease screening where rapid diagnostic test results directly influence treatment decisions. Understanding how to properly design, execute, and interpret blinded panel testing helps organizations validate their rapid diagnostic test accurately and build confidence in diagnostic data.
Understanding Sensitivity and Specificity in Rapid Diagnostic Test Validation
Defining Sensitivity for Rapid Diagnostic Test Performance
Sensitivity measures the ability of a rapid diagnostic test to correctly identify individuals who actually have the target disease or condition. A rapid diagnostic test with high sensitivity produces few false negatives, meaning it reliably detects positive cases. For example, if a rapid diagnostic test has 95% sensitivity, it will correctly identify 95 out of 100 individuals who truly carry the pathogen. In clinical settings, high sensitivity is especially critical for screening applications where missing positive cases could result in delayed treatment or disease transmission.
Calculating sensitivity requires comparing rapid diagnostic test results against a reference standard, typically a confirmatory laboratory method. The formula is straightforward: sensitivity equals the number of true positives divided by the total number of actual positive cases in the population tested. When evaluating a rapid diagnostic test through blinded panel testing, laboratories must ensure that they use well-characterized, confirmed positive samples so that the rapid diagnostic test sensitivity calculation reflects true diagnostic capability.
Understanding Specificity in Rapid Diagnostic Test Evaluation
Specificity reflects the ability of a rapid diagnostic test to correctly identify individuals who do not have the target disease. High specificity means the rapid diagnostic test generates few false positives, which prevents unnecessary treatment, unnecessary follow-up testing, and unnecessary healthcare resource consumption. A rapid diagnostic test with 98% specificity will correctly identify 98 out of 100 individuals who do not have the condition. For many rapid diagnostic test applications, particularly in low-prevalence populations, specificity is as important as sensitivity for maintaining clinical utility.
Specificity is calculated as the number of true negatives divided by the total number of actual negative cases in the test population. In blinded panel testing, negative samples must be equally well-characterized as positive samples to ensure the rapid diagnostic test specificity calculation is accurate and reliable. Poor specificity in a rapid diagnostic test can lead to overdiagnosis, unnecessary treatment initiation, and loss of confidence in diagnostic results.
Designing a Blinded Panel Testing Protocol for Rapid Diagnostic Test Evaluation
Preparing and Characterizing Test Samples
The foundation of any rigorous rapid diagnostic test evaluation lies in proper sample preparation and reference characterization. Samples used to evaluate a rapid diagnostic test must be independently confirmed using recognized reference methods before being included in the blinded panel. For infectious disease rapid diagnostic test evaluation, confirmatory testing typically involves molecular methods such as PCR, culture, or other validated reference techniques. Each sample in the rapid diagnostic test panel must be assigned a unique identifier that masks its status as positive or negative, ensuring that operators testing the rapid diagnostic test cannot identify sample status or predict expected results.
Sample selection for a rapid diagnostic test blinded panel should represent the intended clinical population and disease prevalence patterns. If the rapid diagnostic test is designed for high-prevalence screening, the panel should include proportionally more positive samples. Conversely, if the rapid diagnostic test targets low-prevalence populations, negative samples should dominate the panel. Additionally, samples should reflect different specimen types when applicable to rapid diagnostic test use, such as throat swabs, nasopharyngeal swabs, or other collection methods relevant to the rapid diagnostic test application.
Establishing Operator Blinding and Protocol Execution
Effective blinding requires that operators conducting the rapid diagnostic test evaluation have no knowledge of the reference test results or expected outcomes. Samples must be coded using random alphanumeric identifiers rather than descriptive labels that might reveal sample status. Documentation must clearly separate the operator's rapid diagnostic test results from the reference characterization data until all testing is complete. This separation ensures that a rapid diagnostic test evaluation cannot be influenced by confirmation bias or observer expectations.
Operators should follow a standardized protocol when testing each sample with the rapid diagnostic test. The protocol must specify exact timing, storage conditions, sample preparation steps, and result interpretation criteria for the rapid diagnostic test. Multiple trained operators testing the rapid diagnostic test can strengthen the evaluation by demonstrating reproducibility across different users. After all rapid diagnostic test results are recorded independently, the blinded data is unmasked and compared against the reference standards to calculate sensitivity and specificity.
Analyzing Results and Interpreting Rapid Diagnostic Test Performance Metrics
Creating and Interpreting Confusion Matrices
Once blinded rapid diagnostic test data collection is complete, results are organized into a confusion matrix that shows how the rapid diagnostic test performed against the reference standard. The confusion matrix displays four categories: true positives (correctly identified positive cases), false positives (negative samples the rapid diagnostic test incorrectly marked as positive), true negatives (correctly identified negative cases), and false negatives (positive samples the rapid diagnostic test missed). This structure allows rapid calculation of sensitivity, specificity, and other derived metrics that describe rapid diagnostic test performance comprehensively.
From the confusion matrix, additional metrics beyond sensitivity and specificity can be calculated for the rapid diagnostic test. Positive predictive value indicates the probability that a positive rapid diagnostic test result actually reflects disease presence, while negative predictive value indicates the probability that a negative rapid diagnostic test result truly indicates absence of disease. These predictive values depend on disease prevalence in the tested population, making them particularly useful for understanding rapid diagnostic test performance in real-world clinical scenarios.
Establishing Confidence Intervals and Statistical Significance
Robust rapid diagnostic test evaluation includes calculating 95% confidence intervals around sensitivity and specificity estimates to communicate the precision of the measurements. Confidence intervals indicate the range within which the true rapid diagnostic test performance metrics likely fall. Narrow confidence intervals suggest precise estimates, while wider intervals reflect greater uncertainty. For regulatory submission and clinical adoption, rapid diagnostic test performance data presented with appropriate confidence intervals demonstrates scientific rigor and allows healthcare providers to assess the reliability of diagnostic claims.
Statistical significance testing helps determine whether observed differences in rapid diagnostic test performance are meaningful or could result from random variation. When comparing rapid diagnostic test performance across different operator groups, sample types, or testing conditions, statistical tests quantify whether differences are genuinely significant. Proper statistical analysis of blinded rapid diagnostic test data strengthens validation studies and increases confidence in the reported sensitivity and specificity metrics for clinical decision-making.
FAQ
Why is blinded testing critical when evaluating rapid diagnostic test performance?
Blinded testing eliminates observer bias and ensures that rapid diagnostic test results reflect genuine device performance rather than operator expectations. When evaluators know whether a sample is positive or negative, they may unconsciously interpret ambiguous results in ways that confirm their expectations. Blinded rapid diagnostic test evaluation prevents this bias and produces objective, reproducible data that stakeholders and regulators can trust for making clinical and procurement decisions.
What sample size is recommended for blinded panel rapid diagnostic test testing?
The appropriate sample size for a rapid diagnostic test blinded panel depends on the target confidence level and acceptable margin of error. Regulatory guidance typically recommends at least 100 positive and 100 negative samples to calculate sensitivity and specificity with reasonable precision in a rapid diagnostic test evaluation. Larger sample sizes, particularly 300 or more samples per category, provide narrower confidence intervals and stronger statistical power when evaluating rapid diagnostic test performance across different demographic groups or clinical scenarios.
How do prevalence and population characteristics affect rapid diagnostic test interpretation?
While sensitivity and specificity of a rapid diagnostic test remain constant regardless of population, predictive values change based on disease prevalence and sample characteristics. In high-prevalence populations, a positive rapid diagnostic test result is more likely to indicate true disease, while in low-prevalence settings, the same positive result carries higher false-positive risk. Understanding this relationship helps clinicians properly interpret rapid diagnostic test results in their specific patient populations and adjust clinical algorithms accordingly for optimal patient management.